In this subject we want to show the different fields within a production program, taking into account the human factor and the different means used to facilitate the procedures.
In order to begin to understand this field, we started using the Proyect program, which consists of the simulation of a project in which the different phases are distributed with different tasks. Introducing the value of products, working time and wages of workers.
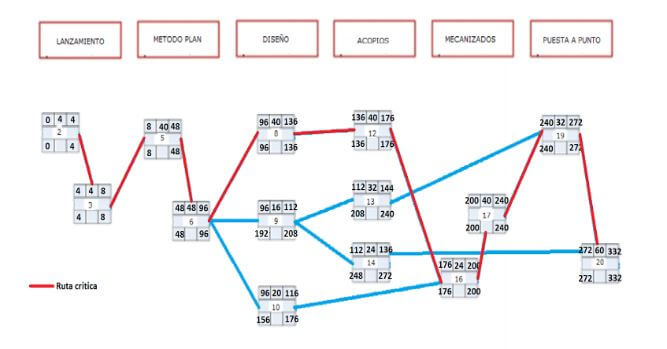
For this we have first used a tool that its function is to evaluate the project and specify our critical route (points of utmost importance in the project), the diagram of Pert.
In this subject the subject was divided into two sections, cylindrical pieces that focused on the accounting part of a workshop and prismatic pieces focused on the warehouse.
Cilindrical Piece
First we start with the cost statements that its function is to provide information regarding the cost of manufacturing a part or lots of parts. For this purpose, the value of the material is calculated according to its weight, the operating time per machine is calculated and, on the basis of the following year, a price is imposed on it in relation to the previous year.
Once the sum is made and the total price of a piece is obtained, a commercial margin is applied (gains on the investment) and in case of having more than one piece is multiplied by the number of pieces.
Having understood the value of what we manufacture, we went to the purchasing system that is distributed in 4 sectors:
- Order – Serves to specify the product needed and the quantities, document that as a company we send to our supplier.
- Albaran – Document that gathers all the orders and justifies that the supplier has delivered the orders, it is generated by the supplier to the company.
- Invoice – Usually it comes with the delivery note and specifies the amount for the delivered product, also the transport of said material can be charged.
- Note from Fertilizer – In case something we do not like as a company is notified to the supplier, an item has not been delivered and has still been collected.
Prismatic Pieces
In the first point different activities were carried out in the field of maintenance, making equipment records with all its physical and technical characteristics and the OEE
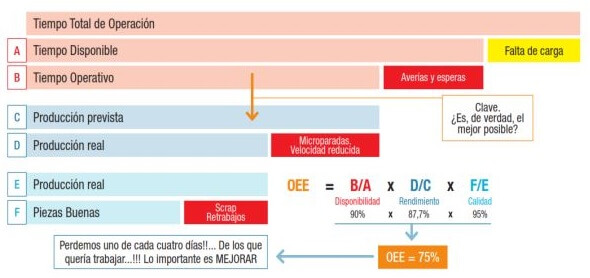
The OEE (Total Effectiveness of Equipment) consists of collecting a series of data ( cycle time, good parts, etc…) from a specific machine and from this a structure is generated in which effectiveness is visualized in different aspects (availability, performance and quality). All in all it generates a percentage that would be the OEE.
In the second point we focus more on the warehouse and we begin a practice with the ABC or Pareto system in which we must distribute various products by groups. The Pareto system collects the data and placing the products from top to bottom generates a graph with the value of the items (in %) and the accumulated % .
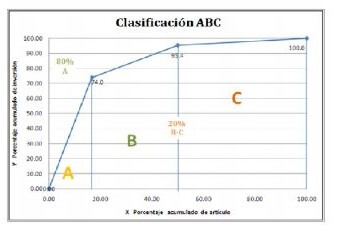
According to Pareto those who accumulate 80% of the expenses is an Article A and would need a strict or rigid revision, those who assume 15% would be B and would have flexible revisions and to finish the last 5% will be C and will not need any revision, Buying one order a year would do.
On the basis of the classification, various measures would be taken, for articles A a Systematic Q or a Systematic P would be required, the difference being that one is a continuous review and the other periodic review respectively. Articles B on the other hand with a visual management would already be worth.
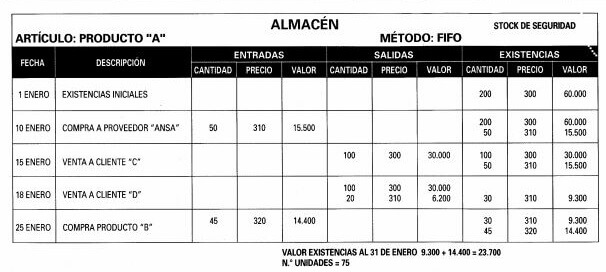
The following control measure has 3 variants: LIFO, FIFO and PMP
These control measures manage the inventory and their own names indicate the sequence they carry. The system LIFO (Last In First Out) the last product that enters the inventory is the first one that comes out, FIFO (First In First Out) the first one that enters is the first one that leaves and PMP (Weighted Average Price) when entering an article this and the one that was becomes one, although the value varied.
To conclude with the section on Prismatics, it is necessary to explain the Kanban, which comes from Japan and means card. To place these types of orders you must have a fixed relationship with the customer since it is not a question of an order, but of providing a certain amount every month.
Para ello se recogen datos de otros mese posteriores y se realiza una media y la desviación de lo que genera la empresa. Con ello, el plazo de entrega y el nivel de servicio se pueden hallar el Stock de Seguridad y el Pipeline Stock. Con ello se suman y obtenemos el numero de unidades que necesitaríamos dividido entre la capacidad del contenedor nos daría el numero de contenedores Kanban necesarios para el mes.